In the July of last year Dataforce delivered “The Company Car Report” which was commissioned by the European Federation for Transport & Environment. The report published in October took us through various aspects of Passenger Cars, Corporate/Commercial registration market for the EU27 + UK as well as selected individual markets. The reports analyses sections from Powertrain, Finances, Taxation, and the growth of the Corporate/Commercial Car section of the Automotive market. Over the coming weeks we will publish selections of the report including updates covering the COVID period and its influence.
How is the Corporate Car market defined?
We should first define just what channels go together to comprise that Corporate/Commercial Car market for Passenger Cars. The main four channels which would include various sub channels are True Fleets, Rent-a-car (RAC) or Short- term rentals (STR), Dealerships, and Manufacturer registrations.
How has the Corporate Car market developed over the last 10 years?
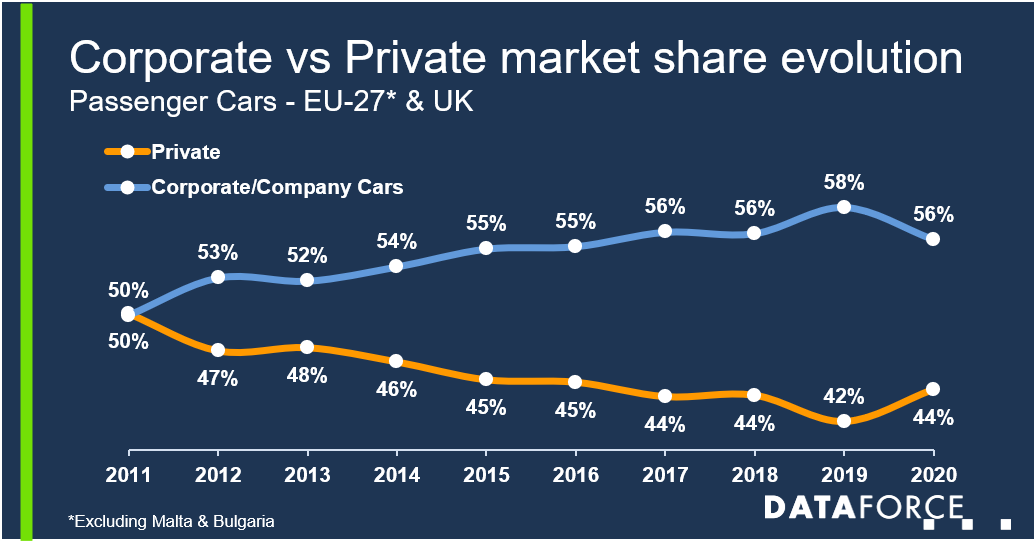
Moving from being the minority channel back in 2011 the Corporate Car market for the EU27 + UK* has continued to expand its footprint, moving from 6.6 million registrations in 2011 to 8.9 million in 2019. Despite the contraction to 56% in 2020 (6.5 million registrations) it should continue to grow – the contraction came largely a result of fewer RAC and Dealership registrations caused by the pandemic. We see the growth in the Corporate car space will come as a result of the less mature markets becoming more active through True Fleets and Leasing & Long-term rental.
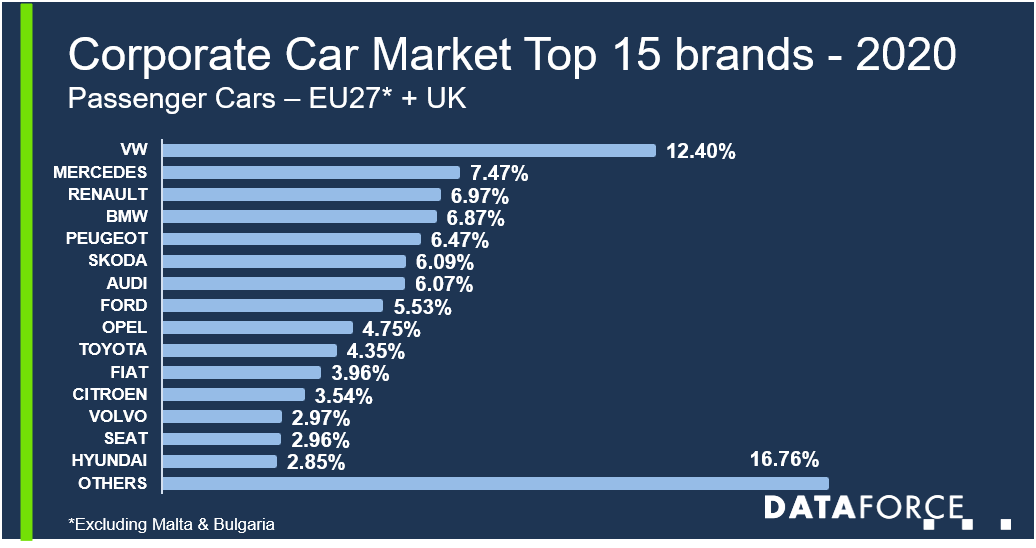
Looking at brands in the corporate car market, Volkswagen currently dominates the Corporate Car market by a healthy margin but the rest of the top 5 are only separated by a little over 60,000 registrations.


