REGIONAL MARKET ANALYSIS

As the market leader for segmented data in the automotive market, we bring regionality and segmentation together. As part of our regional new registration data, we offer unique opportunities such as:
- Potential analyses
- Sales management
- Dealer network plan
- Dealer network control
- Regional area adjustment
WHY Regional?
Paris is different from rural regions, and even in Cologne the potential varies depending on which side of the river you are on. This makes it all the more important to look at the regions individually. And we support you in this.
With our regional analyses for the automotive industry, we evaluate the current market situation and make all important key figures visible for you.
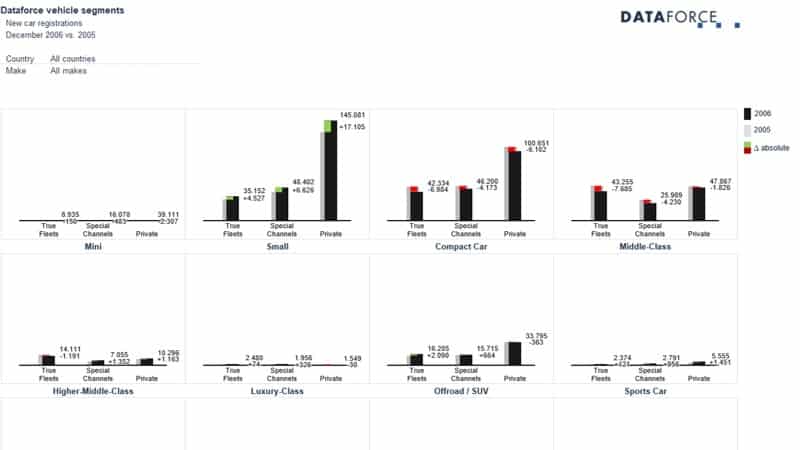
The breakdown of the different market channels (private, fleet, special influences) shows where your dealers need to become more active and which conquest potentials exist in certain regions.
Generated from our data you could use the regional insights to evaluate the greenest region in a specific country based on EV new registrations or the regions with the most fleets with 50 or more vehicles.
Use the regional analysis methods to track the market development of your brand in comparison to competitors and derive strategic decisions from it.
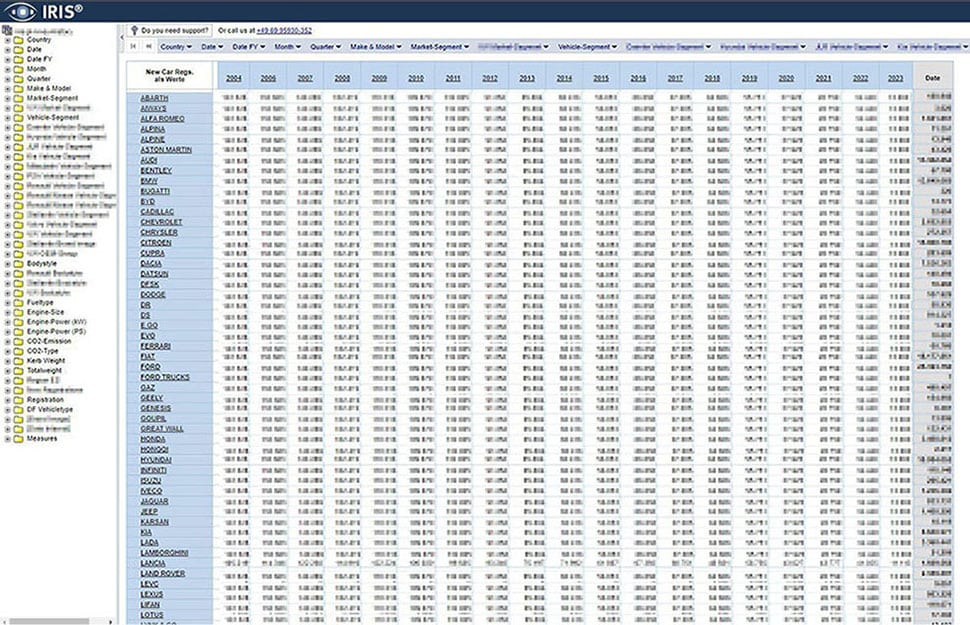
The data is delivered and edited tailored to your needs. Either in our smart management system IRIS VIEWS, which allows easy analysis, in our dealer network planning suite IRIS NET, or in our flexible analysis tool IRIS for all market analysts. Individual data reports in different formats are also possible.
We evaluate the following key figures for you, for example:
1. How many vehicles were registered in the area last month?
2. Is this development positive?
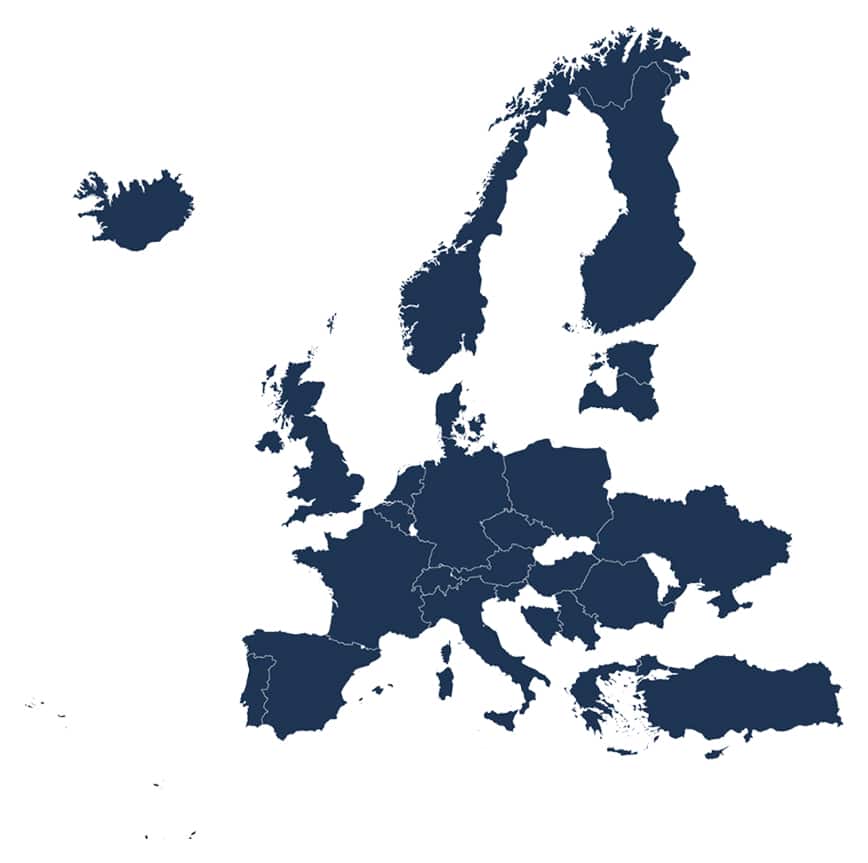
3. Are there differences compared to the rest of Europe?
4. How is the development of my brand?
5. What potential is there for my brand?
6. Which models are in particular demand?
7. Which fuel types are demanded by which customer groups (private or companies)?
8. How high is my market share?
9. Are there any differences compared with Europe as a whole?
10. With which customer groups is my brand particularly successful?

Why Dataforce?
With over 25 years of experience in the automotive industry, we know what matters when it comes to data. In addition to the quality and depth of the data, the focus is on comprehensibility and availability.That is why we work exclusively with the direct source (KBA, authorities) and market-leading system providers such as IBM and Tableau in over 40 countries. Our customers include the major automotive groups, as well as importers, dealer groups, petroleum companies and many more. Find out more about our references here.
How would you like your data?
Dashboards in TABLEAU
IRIS VIEWS® is a smart management dashboard system. Intuitive displays with drill-down options, make analysis fast, easy and detailed.
In addition to standard dashboards, individual customer requirements can also be implemented. For example, other data sources can be integrated in addition to customer colors.
Define your very own analysis path or rely on 25 years of market experience.
Network planning and analysis with IRIS Net
With IRIS NET® we offer a fully comprehensive dealer network planning suite. Dealer networks can be processed “on-the-fly” and detailed analyses can be performed immediately. Different levels are kept available in order to be able to assess the results of new locations in advance. Deployment can be in full access or, depending on requirements, only with small, simple dashboards.
IBM Cognos Viewer
IBM Cognos Viewer, our convenient and flexible online analysis tool that allows market analysts to examine what’s happening in the marketplace – easy download for further data processing.
File or Feed
Individuality and customization are our strength. As PPT, PDF, XLS, HTML or via an API we provide you with the data in a user-friendly and tailored way.
Regional insights generated from our data
Do you have any questions about our products? Our representatives will be happy to provide you with non-binding information:
Customer Services
Phone: +49 69 95930-352
Fax:+49 69 95930-549
Email: customer-services@dataforce.de
www.dataforce.de


